Choose License Type
The global intraocular lens market was valued at USD 6,887.0 million in the year 2019 and is anticipated to grow at a CAGR of 5.9% over the forecast period of 2020 to 2026. Growth in number of cataract patients coupled with other medical conditions such as diabetes causing retinopathy is anticipated to drive the global market for intraocular lenses in coming years.
Despite several years of optimization of the results of cataract surgery and several IOL technology advances taking place, achieving the optimal refractive outcomes still pose challenges. Several studies suggest that only half of the patients lie in the high satisfaction range of attaining ideal eyesight. Some of the major technological developments rendering positive growth opportunities in this space are mentioned ahead. Pseudoaccomodative multifocality technology and its latest models improve visual quality with proven patient satisfaction. The latest FluidVision technology exploits the concept of fluid dynamics in the lens in response to the forces in the capsule. The Juven accommodating intraocular lens (LensGen), addresses the issue of size, and splits the lens in two different components that can in inserted through small incisions. This lens assists in regaining near vision without dysphotopsia. Variation in the biometry at present remains the major source of error in effective lens positioning. The Gemini refractive capsule (from Omega Ophthalmics) is a silicone based 3D platform capsular tensioning ring, which is implanted post cortex removal. This helps in keeping the capsular bag open in a natural conformation while effectively holding the lens at the desired position.
Key segments of the global intraocular lens market
Product Overview, 2014-2026 (USD Million)
Material Overview, 2014-2026 (USD Million)
End Use Overview, 2014-2026 (USD Million)
Regional Overview, 2014-2026 (USD Million)
Reasons for the study
What does the report include?
Who should buy this report?
The global intraocular lens (IOLs) market is anticipated to progress at a CAGR of 5.9% during the forecast period between 2020 and 2026. Some of the key factors supporting the growth of this market is increasing incidence of ophthalmic conditions such as cataract, macular degeneration etc. High prevalence of obesity and diabetes also leads to high risk and incidence of ophthalmic conditions. Rowing prevalence of cataract contributes to huge economic and social burden, globally. This has led to introduction of different initiatives by governments and healthcare bodies and organizations regarding early diagnosis and treatment of cataract. Vision 202 is one of such initiatives by the International Agency for the Prevention of Blindness. This movement aims at elimination of the causative factors for emergence of avoidable blindness. There is also an active participation from governments to achieve such target through initiating eye check up camps, awareness programs etc. such movements are anticipated to drive the global intraocular lens market. Conversely, lack of reimbursements or copayments, and high costs of premium IOLs restrict the market from growing at its full potential. Further cost containment, and improving awareness in the emerging economies shall open new growth opportunities in the near future.
The global intraocular lens market is consolidated in nature with major players accounting for over 60% of the overall market share. Key players within the market include Alcon, Inc., Johnson & Johnson, Bausch & Lomb, Inc., and Carl Zeiss Meditec AG. Key players are concentrating on new product launches and acquisitions to expand their presence. For instance, in October 2019, Johnson & Johnson Vision Care launched TECNIS Eyhance™ monofocal intraocular lens in India to deliver high-quality distance vision along with better low-light contrast. Furthermore, In December 2019, Bausch & Lomb launched a new product VYZULTA® (latanoprostene bunod ophthalmic solution, 0.024%) under the Ontario Public Drug Benefit (ODB) Program, which will help to reduce intraocular pressure (IOP) in patients with open-angle glaucoma or ocular hypertension. Such strategies is likely to increase the penetration of global leaders in untapped markets.
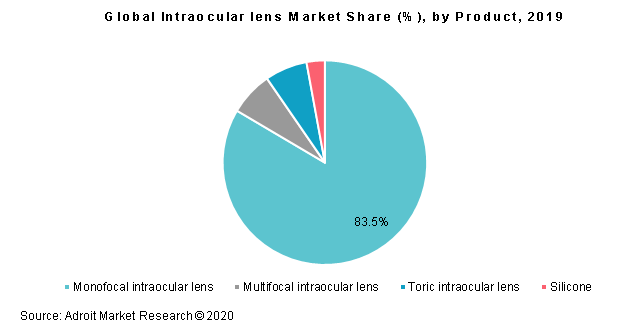
Monofocal intraocular lens are the most commonly used lens in a majority of the cases. Similar opinion is also shared by a majority of ophthalmic surgeons worldwide. Ease of use, and consistency in surgical outcomes form the key factors for high preference by surgeons to monofocal intraocular lens. Some popular brands in this space are the Alcon IQ Aspheric IOL, J&J Vision Tecnis one-piece lens, B+L enVista, SofPort AO, and Akreos AO. The lens mostly fold slowly, have acrylic material and thus have less chances of causing inflammation or interference with silicone oil retinal procedures. Monofocal lens are more preferred as they are mostly fully covered by insurance.
Based on regions, the global intraocular lens market is segmented into North America, Europe, Asia Pacific, Central and South America and Middle East & Africa.
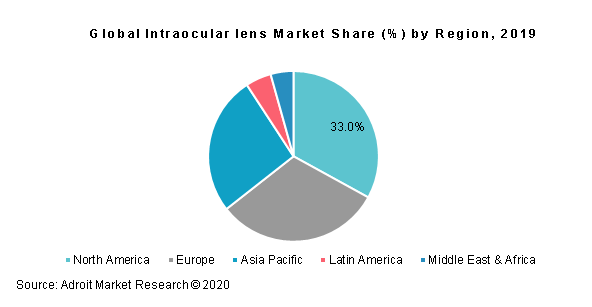
U.S. dominates the intraocular lens market across the North American region and is anticipated to grow at a CAGR of 5.3% over the forecast period. The market is forecasted to surpass mark of USD 2.5 billion by the year 2026. The rise in the number of technological advancements such as extended depth of focus and custom cataract lens from the manufacturers has proliferated the demand for the intraocular lens in the North America market.
The United States recorded around 7.7 million diabetic retinopathy cases and 24 million cataract cases in the year 2018, according to the National Eye Institute, and is forecast to reach 11.3 million and 38 million by the year 2030, respectively. In addition, the American Association of Ophthalmology states that a cataract is reported to be the major cause of visual impairment at the global level, and geriatric eye problems among the people is emerging as a prime factor in some of the developing countries. It is therefore predicted that such an improvement in ophthalmic conditions would drive the U.S. market growth for the intraocular lenses over the forecast period.
The global intraocular lens market was valued at USD 6,887.0 million in the year 2019 and is anticipated to grow at a CAGR of 5.9% over the forecast period of 2020 to 2026. Growth in number of cataract patients coupled with other medical conditions such as diabetes causing retinopathy is anticipated to drive the global market for intraocular lenses in coming years.
Despite several years of optimization of the results of cataract surgery and several IOL technology advances taking place, achieving the optimal refractive outcomes still pose challenges. Several studies suggest that only half of the patients lie in the high satisfaction range of attaining ideal eyesight. Some of the major technological developments rendering positive growth opportunities in this space are mentioned ahead. Pseudoaccomodative multifocality technology and its latest models improve visual quality with proven patient satisfaction. The latest FluidVision technology exploits the concept of fluid dynamics in the lens in response to the forces in the capsule. The Juven accommodating intraocular lens (LensGen), addresses the issue of size, and splits the lens in two different components that can in inserted through small incisions. This lens assists in regaining near vision without dysphotopsia. Variation in the biometry at present remains the major source of error in effective lens positioning. The Gemini refractive capsule (from Omega Ophthalmics) is a silicone based 3D platform capsular tensioning ring, which is implanted post cortex removal. This helps in keeping the capsular bag open in a natural conformation while effectively holding the lens at the desired position.
Key segments of the global intraocular lens market
Product Overview, 2014-2026 (USD Million)
Material Overview, 2014-2026 (USD Million)
End Use Overview, 2014-2026 (USD Million)
Regional Overview, 2014-2026 (USD Million)
Reasons for the study
What does the report include?
Who should buy this report?
Chapter 1 Executive Summary
Chapter 2 Research Methodology
2.1 Research Methodology
2.2 Market Size Estimation Methodology
2.3 Forecasting Methodology
2.4 Scope, definition, and assumptions
2.5 Assumptions
2.6 Data sources
Chapter 3 Market Outlook
3.1 Introduction
3.2 Market Dynamics
3.2.1 Impact Analysis of Drivers, Restraints and Future Prospects during the forecast period
3.2.2 Market restraints
3.2.2.1 High costs of advanced treatments
3.2.2.2 Lack of appropriate copayments for premium IOLs
3.2.3 Market opportunities
3.3 Upstream and downstream Buyers analysis
3.4 Raw material sources
3.5 Value chain analysis
3.6 Porter’s Five Forces analysis
3.7 Price Trend Analysis
3.8 Company market share analysis, 2019 (%)
Chapter 4 Global Intraocular Lens Market Overview, By Product Type
4.1 Global intraocular lens market share, by product type, 2019 & 2026 (USD million)
4.2 Monofocal intraocular lens
4.2.1 Market size and projections, 2014 – 2026
4.3 Toric intraocular lens
4.3.1 Market size and projections, 2014 – 2026
4.4 Accomodative intraocular lens
4.4.1 Market size and projections, 2014 – 2026
4.5 Multifocal intraocular lens
4.5.1 Market size and projections, 2014 – 2026
Chapter 5 Global Intraocular Lens Market Overview, By Material
5.1 Global intraocular lens market share, by material, 2019 & 2026 (USD million)
5.2 Hydrophobic acrylic
5.2.1 Market size and projections, 2014 – 2026
5.3 Hydrophilic acrylic
5.3.1 Market size and projections, 2014 – 2026
5.4 PMMA
5.4.1 Market size and projections, 2014 – 2026
5.5 Silicone intraocular lens
5.5.1 Market size and projections, 2014 – 2026
Chapter 6 Global Intraocular Lens Market Overview, By End Use
6.1 Global intraocular lens market share, by end use, 2019 & 2026 (USD million)
6.2 Hospitals
6.2.1 Market size and projections, 2014 – 2026
6.3 Ophthalmic clinics
6.3.1 Market size and projections, 2014 – 2026
6.4 Ambulatory surgery centers
6.4.1 Market size and projections, 2014 – 2026
6.5 Research and academia
6.5.1 Market size and projections, 2014 – 2026
Chapter 7 Regional/Country Overview
7.1 Global intraocular lens market share, by region/country, 2019 & 2026
7.2 U.S.
7.2.1 Market size and projections, 2014 – 2026
7.2.2 Market size and projections, by product type, 2014 – 2026
7.2.3 Market size and projections, by material, 2014 – 2026
7.2.4 Market size and projections, by end-use, 2014 – 2026
7.3 Europe
7.3.1 Market size and projections, 2014 – 2026
7.3.2 Market size and projections, by product type, 2014 – 2026
7.3.3 Market size and projections, by material, 2014 – 2026
7.3.4 Market size and projections, by end-use, 2014 – 2026
7.3.5 Germany
7.3.5.1 Market size and projections, 2014 – 2026
7.3.5.2 Market size and projections, by product type,2014 – 2026
7.3.5.3 Market size and projections, by material, 2014 – 2026
7.3.5.4 Market size and projections, by end-use, 2014 – 2026
7.3.6 UK
7.3.6.1 Market size and projections, 2014 – 2026
7.3.6.2 Market size and projections, by product type,2014 – 2026
7.3.6.3 Market size and projections, by material, 2014 – 2026
7.3.6.4 Market size and projections, by end-use, 2014 – 2026
7.3.7 Italy
7.3.7.1 Market size and projections, 2014 – 2026
7.3.7.2 Market size and projections, by product type,2014 – 2026
7.3.7.3 Market size and projections, by material, 2014 – 2026
7.3.7.4 Market size and projections, by end-use, 2014 – 2026
7.3.8 France
7.3.8.1 Market size and projections, 2014 – 2026
7.3.8.2 Market size and projections, by product type,2014 – 2026
7.3.8.3 Market size and projections, by material, 2014 – 2026
7.3.8.4 Market size and projections, by end-use, 2014 – 2026
7.3.9 Russia
7.3.9.1 Market size and projections, 2014 – 2026
7.3.9.2 Market size and projections, by product type,2014 – 2026
7.3.9.3 Market size and projections, by material, 2014 – 2026
7.3.9.4 Market size and projections, by end-use, 2014 – 2026
7.3.10 Spain
7.3.10.1 Market size and projections, 2014 – 2026
7.3.10.2 Market size and projections, by product type,2014 – 2026
7.3.10.3 Market size and projections, by material, 2014 – 2026
7.3.10.4 Market size and projections, by end-use, 2014 – 2026
7.3.11 Poland
7.3.11.1 Market size and projections, 2014 – 2026
7.3.11.2 Market size and projections, by product type,2014 – 2026
7.3.11.3 Market size and projections, by material, 2014 – 2026
7.3.11.4 Market size and projections, by end-use, 2014 – 2026
7.3.12 Rest of Europe
7.3.12.1 Market size and projections, 2014 – 2026
7.3.12.2 Market size and projections, by product type,2014 – 2026
7.3.12.3 Market size and projections, by material, 2014 – 2026
7.3.12.4 Market size and projections, by end-use, 2014 – 2026
7.4 Asia Pacific
7.4.1 Market size and projections, 2014 – 2026
7.4.2 Market size and projections, by product type, 2014 – 2026
7.4.3 Market size and projections, by material, 2014 – 2026
7.4.4 Market size and projections, by end-use, 2014 – 2026
7.5 China
7.5.1 Market size and projections, 2014 – 2026
7.5.2 Market size and projections, by product type, 2014 – 2026
7.5.3 Market size and projections, by material, 2014 – 2026
7.5.4 Market size and projections, by end-use, 2014 – 2026
7.6 Japan
7.6.1 Market size and projections, 2014 – 2026
7.6.2 Market size and projections, by product type, 2014 – 2026
7.6.3 Market size and projections, by material, 2014 – 2026
7.6.4 Market size and projections, by end-use, 2014 – 2026
7.7 India
7.7.1 Market size and projections, 2014 – 2026
7.7.2 Market size and projections, by product type, 2014 – 2026
7.7.3 Market size and projections, by material, 2014 – 2026
7.7.4 Market size and projections, by end-use, 2014 – 2026
7.7.5 Malaysia
7.7.5.1 Market size and projections, 2014 – 2026
7.7.5.2 Market size and projections, by product type,2014 – 2026
7.7.5.3 Market size and projections, by material, 2014 – 2026
7.7.5.4 Market size and projections, by end-use, 2014 – 2026
7.7.6 Singapore
7.7.6.1 Market size and projections, 2014 – 2026
7.7.6.2 Market size and projections, by product type,2014 – 2026
7.7.6.3 Market size and projections, by material, 2014 – 2026
7.7.6.4 Market size and projections, by end-use, 2014 – 2026
7.7.7 Philippines
7.7.7.1 Market size and projections, 2014 – 2026
7.7.7.2 Market size and projections, by product type,2014 – 2026
7.7.7.3 Market size and projections, by material, 2014 – 2026
7.7.7.4 Market size and projections, by end-use, 2014 – 2026
7.7.8 Indonesia
7.7.8.1 Market size and projections, 2014 – 2026
7.7.8.2 Market size and projections, by product type,2014 – 2026
7.7.8.3 Market size and projections, by material, 2014 – 2026
7.7.8.4 Market size and projections, by end-use, 2014 – 2026
7.7.9 Thailand
7.7.9.1 Market size and projections, 2014 – 2026
7.7.9.2 Market size and projections, by product type,2014 – 2026
7.7.9.3 Market size and projections, by material, 2014 – 2026
7.7.9.4 Market size and projections, by end-use, 2014 – 2026
7.7.10 Vietnam
7.7.10.1 Market size and projections, 2014 – 2026
7.7.10.2 Market size and projections, by product type,2014 – 2026
7.7.10.3 Market size and projections, by material, 2014 – 2026
7.7.10.4 Market size and projections, by end-use, 2014 – 2026
7.8 Central & South America
7.8.1 Market size and projections, 2014 – 2026
7.8.2 Market size and projections, by product type, 2014 – 2026
7.8.3 Market size and projections, by material, 2014 – 2026
7.8.4 Market size and projections, by end-use, 2014 – 2026
7.8.5 Brazil
7.8.5.1 Market size and projections, 2014 – 2026
7.8.5.2 Market size and projections, by product type,2014 – 2026
7.8.5.3 Market size and projections, by material, 2014 – 2026
7.8.5.4 Market size and projections, by end-use, 2014 – 2026
7.8.6 Mexico
7.8.6.1 Market size and projections, 2014 – 2026
7.8.6.2 Market size and projections, by product type,2014 – 2026
7.8.6.3 Market size and projections, by material, 2014 – 2026
7.8.6.4 Market size and projections, by end-use, 2014 – 2026
7.8.7 Colombia
7.8.7.1 Market size and projections, 2014 – 2026
7.8.7.2 Market size and projections, by product type,2014 – 2026
7.8.7.3 Market size and projections, by material, 2014 – 2026
7.8.7.4 Market size and projections, by end-use, 2014 – 2026
7.9 Middle East and Africa
7.9.1 Market size and projections, 2014 – 2026
7.9.2 Market size and projections, by product type, 2014 – 2026
7.9.3 Market size and projections, by material, 2014 – 2026
7.9.4 Market size and projections, by end-use, 2014 – 2026
7.9.5 Saudi Arabia
7.9.5.1 Market size and projections, 2014 – 2026
7.9.5.2 Market size and projections, by product type,2014 – 2026
7.9.5.3 Market size and projections, by material, 2014 – 2026
7.9.5.4 Market size and projections, by end-use, 2014 – 2026
7.9.6 UAE
7.9.6.1 Market size and projections, 2014 – 2026
7.9.6.2 Market size and projections, by product type,2014 – 2026
7.9.6.3 Market size and projections, by material, 2014 – 2026
7.9.6.4 Market size and projections, by end-use, 2014 – 2026
7.9.7 Turkey
7.9.7.1 Market size and projections, 2014 – 2026
7.9.7.2 Market size and projections, by product type,2014 – 2026
7.9.7.3 Market size and projections, by material, 2014 – 2026
7.9.7.4 Market size and projections, by end-use, 2014 – 2026
7.9.8 Egypt
7.9.8.1 Market size and projections, 2014 – 2026
7.9.8.2 Market size and projections, by product type,2014 – 2026
7.9.8.3 Market size and projections, by material, 2014 – 2026
7.9.8.4 Market size and projections, by end-use, 2014 – 2026
7.9.9 South Africa
7.9.9.1 Market size and projections, 2014 – 2026
7.9.9.2 Market size and projections, by product type,2014 – 2026
7.9.9.3 Market size and projections, by material, 2014 – 2026
7.9.9.4 Market size and projections, by end-use, 2014 – 2026
7.9.10 Nigeria
7.9.10.1 Market size and projections, 2014 – 2026
7.9.10.2 Market size and projections, by product type,2014 – 2026
7.9.10.3 Market size and projections, by material, 2014 – 2026
7.9.10.4 Market size and projections, by end-use, 2014 – 2026
Chapter 8 Company Profiles
8.1 Johnson & Johnson Vision Care, Inc
8.1.1 Company overview
8.1.2 Product Portfolio
8.1.3 Financial performance (Johnson & Johnson)
8.1.4 Financial performance (Johnson & Johnson - Vision)
8.1.5 Key developments
8.2 Bausch & Lomb, Inc.
8.2.1 Company overview
8.2.2 Product Portfolio
8.2.3 Financial performance (Bausch Health Companies Inc.)
8.2.4 Financial performance (Bausch & Lomb, Inc.)
8.2.5 Key developments
8.3 Alcon, Inc.
8.3.1 Company overview
8.3.2 Product Portfolio
8.3.3 Financial performance (Alcon, Inc.)
8.3.4 Key developments
8.4 Carl Zeiss Meditec AG
8.4.1 Company overview
8.4.2 Product Portfolio
8.4.3 Financial performance (Carl Zeiss Meditec AG)
8.4.4 Key developments
8.5 Rayner Intraocular Lenses Ltd.
8.5.1 Company overview
8.5.2 Product Portfolio
8.5.3 Financial performance (Rayner Intraocular Lenses Ltd.)
8.5.4 Key developments
8.6 EyeKon Medical, Inc.
8.6.1 Company overview
8.6.2 Product Portfolio
8.6.3 Financial performance (EyeKon Medical, Inc.)
8.7 Lenstec, Inc.
8.7.1 Company overview
8.7.2 Product Portfolio
8.7.3 Financial performance (Lenstec, Inc.)
8.7.4 Key developments
8.8 HumanOptics AG
8.8.1 Company overview
8.8.2 Product Portfolio
8.8.3 Financial performance (HumanOptics AG)
8.8.4 Key developments
8.9 STAAR Surgical Company
8.9.1 Company overview
8.9.2 Product Portfolio
8.9.3 Financial performance (STAAR Surgical Company)
8.9.4 Key developments
8.10 Hoya Corporation
8.10.1 Company overview
8.10.2 Product Portfolio
8.10.3 Financial performance (Hoya Corporation)
8.10.4 Key developments
8.11 TEKIA, Inc.
8.11.1 Company overview
8.11.2 Product Portfolio
8.11.3 Financial performance (TEKIA, Inc.)
8.12 SAV-IOL SA
8.12.1 Company overview
8.12.2 Product Portfolio
8.12.3 Financial performance (SAV-IOL SA)
8.12.4 Key developments
8.13 Oculentis B.V.
8.13.1 Company overview
8.13.2 Product Portfolio
8.13.3 Financial performance (Oculentis B.V.)
8.13.4 Key developments
8.14 Ophtec B.V.
8.14.1 Company overview
8.14.2 Product Portfolio
8.14.3 Financial performance (Ophtec B.V.)
8.14.4 Key developments
8.15 Omni Lens Pvt Ltd
8.15.1 Company overview
8.15.2 Product Portfolio
8.16 Akkolens International BV
8.16.1 Company overview
8.16.2 Product Portfolio
8.16.3 Financial performance (Akkolens International BV)
8.16.4 Key development